Trash Panda
Worked for 8 weeks as a machine learning engineer on a remote interdisciplinary team; helped gather and label over 80,000 images to train an object detection model; built a Flask API to deploy model.
The Problem
You have an object in your hand that you intend to throw away. When you think about it as you're walking to the bins, you realize you actually don't know whether this type of object is recyclable or not. Maybe it is made of multiple different materials, or of an uncommon or unrecognizable material.
You're in the middle of an important project, and it's crunch time—no extra time available to spend researching. You end up throwing it in the recycling because it...well, it seems like something that would be recyclable. With the decision made and action taken, you return to your important project, forgetting all about what just transpired.
I'd bet that most who are reading this have had an experience like this.
The priceless time and energy spent researching how to properly dispose of every single item can add up. However, the US is in something of a recycling crisis at the moment, partially due to the low quality of our recyclable waste—it tends to be very intermixed with non-recyclables.
Ever since China's National Sword legislation in 2017, which vastly reduced the amount of foreign recycling—particularly low-quality—the country would accept, recycling companies in the US have been forced to grapple with this quality issue. The cost of recycling increases when more trash is intermingled with it, as more sorting has to occur prior to processing. Whether it is more expensive machines or higher cost of labor, sorting costs money.
While the domestic recycling infrastructure will (hopefully) grow to meet the increasing demand, the best way to solve a problem is to address the source of the issue, not the symptoms. One key reason for the low quality recycling is simply a lack of easily accessible information. Even with the power of modern search engines at our fingertips, finding relevant recycling information can take a long time, as what exactly constitutes recycling changes depending on area and company.
The simple fact is that most people don't want to spend the additional time it takes (at least up front) to have good recycling habits. So why not simply remove that additional time from the equation?
The Solution
The goal was to build an app that helps to foster better recycling habits by reducing the the effort needed to find accurate and relevant information on how to properly dispose of any given item of waste. To make this possible, we needed to reduce the friction so much so that looking up how to dispose of something that a user is holding in their hand is just as quick and easy as debating for a few moments on what bin it goes in.
Put another way, our goal was to reduce the cognitive tax of getting relevant recycling information so much that disposing of every item of waste properly, regardless of what it is, becomes effortless.
Our stakeholder envisioned that the user would simply snap a photo of something they are about to toss. Then, the app's computer vision (object detection) functionality would recognize the object and automatically pull up the relevant information on how it should be disposed of according to the user's location and available services. The user would know immediately if the item should be thrown in the trash, recycle, or compost, or if it is recyclable only at an offsite facility. For the latter case, the user would be able to view a list of nearby facilities that accept the item or material.
The result of this vision is a progressive web app (PWA) called Trash Panda, which does just that. You can try out the app on your mobile device now by following the link below.
A note on PWAs
For those who aren't familiar, a PWA is basically a web app that can both be used via the browser and downloaded to the home screen of a mobile device. Google has been moving to fully support PWAs, meaning Trash Panda is available on the Play Store right now. Of course the benefit of a PWA is you don't actually have to download it at all if you don't want to. You can use it directly from the browser.
Apple is pretty far behind in their support of PWAs. As a result, the behavior on an iOS device is not ideal. For those on iOS, be sure to use Safari. And when taking a picture of an item, you have to exit out of the video window before pressing the normal shutter button.
You'll figure it out—we believe in you!
The Team (and My Role On It)
For eight weeks near the beginning of 2020, I worked with a remote interdisciplinary team to bring the vision of Trash Panda to life.
Trash Panda is by far the most ambitious machine learning endeavor I had yet embarked on. Indeed, it was the largest software project I'd worked on in just about every respect: time, team, ambition, breadth of required knowledge. As such, it provided to me many valuable, foundational experiences that I'll surely keep with me throughout my entire career.
I seriously lucked out on the team for this project. Every single one of them was hard-working, thoughtful, friendly—a pleasure to work with. The team included myself and three other machine learning engineers, four web developers, and two UX designers (links to all of their respective sites in the Final Thoughts section below). Our stakeholder Trevor Clack, who came up with the idea for the app and pitched it to Labs, also worked on the project as a machine learning engineer.
Trevor's Trash Panda blog post We all pushed ourselves throughout each and every day of the eight weeks to make Trevor's vision come to life, learning entirely new technologies, frameworks, skills, and processes along the way.
For example, the web developers taught themselves how to use GraphQL, along with a variety of related/dependent technology. On the machine learning side of things, none of us had significant applied experience with computer vision (CV) going into the project. We'd spent a few days studying and working with it in the Deep Learning unit of our Lambda School curriculum. But that was more to expose us to it, rather than covering the entire process in-depth. We had only the shallowest of surface scratches compared to what was ultimately needed to meet the vision set out for us.
As the machine learning engineers on the team, we were responsible for the entire process of getting an object detection system built, trained, deployed, and integrated with the app. Basically, we were starting from scratch, both in the sense of a greenfield project and of us being inexperienced with CV.
Of course, CV is still machine learning—many steps in the process are similar to any other supervised machine learning project. But working with images comes with its own suite of unique challenges that we had to learn how to overcome.
We split up the work as evenly as possible, given our initially limited knowledge of the details, with some steps being split up between some or all of us, and other steps having a sole owner.
The first step for which I was solely responsible included building a system to automatically remove the background from images (or extract the foreground, depending on how you look at it). Essentially, when tasked with figuring out a way to automate the process of removing the background from images so they could be auto-labeled via a script written by Trevor, I built a secondary pipeline with a pre-trained image segmentation model. More details can be found in the Automated Background Removal section below.
Furthermore, I was responsible for building and deploying the object detection API. I built the API using Flask, containerized it with Docker, and deployed it to AWS Elastic Beanstalk. I go into a little more detail in the Deployment section below, though I will be digging into the code and process of the API much more in a separate blog post.
All members of the machine learning team contributed to the gathering and labeling of the dataset. To this end, each of us ended up gathering and labeling somewhere in the range of 20,000 images, for a total of over 82,000.
Classifications
As also seems to be the case with most, if not all, projects in general, we were almost constantly grappling with scope management. In an ideal world, our model would be able to recognize any object that anyone would ever want to throw away. But in reality is this is practically impossible, particularly within the 8 weeks we had to work on Trash Panda. I say "practically" because I'm sure if a company dedicated enough resources to the problem, eventually it could be solved, at least to some degree.
Fortunately, we were granted an API key from Earth911 (shoutout to them for helping out!) to utilize their recycling center search database. At the time we were working with it, the database held information on around 300 items—how they should be recycled based on location, and facilities that accept them if they are not curbside recyclable. They added a number of items when we were already most of the way done with the project, and have likely added more since then.
We had our starting point for the list of items our system should be able to recognize. However, the documentation for the neural network architecture we'd decided to use suggested that to create a robust model, it should be trained with at least 1,000 instances (in this case, images) of each of the classes we wanted it to detect.
Gathering 300,000 images was also quite a bit out of the scope of the project at that point. So, the DS team spent many hours reducing the size of that list to something a little more manageable and realistic.
The main method of doing so was to group the items based primarily on visual similarity. We knew it was also out of the scope of our time with the project to train a model that could tell the difference between #2 plastic bottles and #3 plastic bottles, or motor oil bottles and brake fluid bottles.
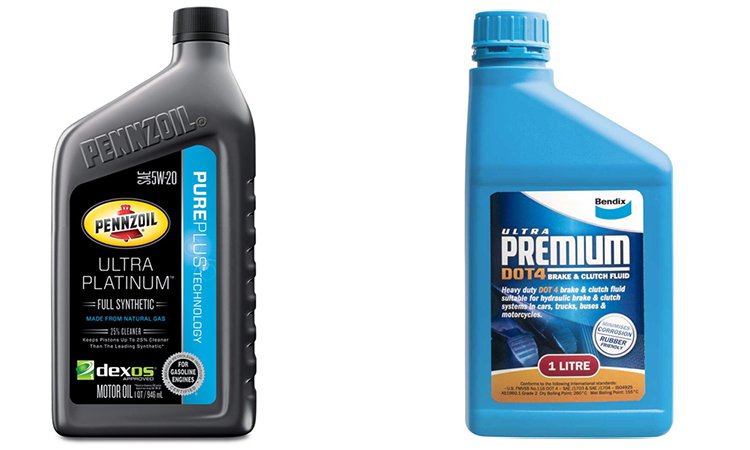
Given enough time and resources, who knows? Maybe we could train a model that accurately recognizes 300+ items and distinguishes between similar-looking items. But we had to keep our scope realistic to be sure that we actually finished something useful in the time we had.
We also considered the items that 1) users would be throwing away on a somewhat regular basis, and 2) users would usually either be unsure of how to dispose of properly or would dispose of properly. More accuracy on the important and/or common items would be more valuable to users. Some items were not grouped.
By the end of this process, we managed to cluster and prune the original list of about 300 items and materials down to 73.
Image Data Pipelines
We figured that in order to get through gathering and labeling 70,000+ images with only four people, within our timeframe, and without any budget whatsoever, we had to get creative and automate as much of the process as possible.
As explained below, the image gathering step required significant manual labor. However, we had a plan in place for automating most of the rest of the process. Below is a general outline of the image processing and labeling pipeline we built.
- Rename the images to their md5sum hash to avoid duplicates and ensure unique filenames
- Resize the images to save storage (and processing power later on)
- Discern between transparent background and non-transparent background
- If image is non-transparent, remove the background
- Automatically draw bounding boxes around the object (the foreground)
- If image is transparent, add a background
The beauty of automation is once the initial infrastructure is built and working, the volume can be scaled up indefinitely. The auto-labeling functionality was not perfect by any means. But it still felt great watching this pipeline rip through large batches of images.
Gather
The first part of the overall pipeline was gathering the images—around 1,000 for each of the 73 classes. This was a small pipeline in its own right, which unfortunately involved a fair bit of manual work.
Timothy built the piece of the image gathering pipeline that allowed us to at least automate some of it—the downloading part. Bing ended up being the most fruitful source of images for us. Before starting we expected to use Google Images, but pivoted when it turned out that Bing's API was much more friendly to scraping and/or programmatically downloading.
Timothy's blog post about the Trash Panda project can be found here: Games by Tim - Trash Panda.
We used his script, which in turn used a Python package called Bulk-Bing-Image-downloader, to gather the majority of images. (I say majority because we also used some images from Google's Open Images Dataset and COCO.)
The gathering process was a mixture of downloading and sifting. As we were pulling images straight from the internet, irrelevant images inevitably found their way into the search queries somehow. For each class, we went through a iterative (and somewhat tedious) loop until we had around 1,000 images of that class. The steps were simple, yet time-consuming:
- Gather a batch of images (usually several hundred at a time) from Bing using a script written by Timothy
- Skim through them, removing irrelevant and/or useless images
The latter was what made this pipeline difficult to fully automate, as we couldn't think of any good way of automatically vetting the images. (Though I did write a script to help me sift through images as quickly as possible, which will be the topic of a future blog post.) We had to be sure the images we were downloading in bulk actually depicted the class of item in question.
As they say, "garbage in, garbage out."
And in case you weren't aware, the internet is full of garbage.
Annotate
To train an object detection model, each image in the training dataset must be annotated with rectangular bounding boxes (or, more accurately, the coordinates that define the bounding box) surrounding each of the objects belonging to a class that we want the model to recognize. These are used as the label, or target, for the model—i.e. what the model will be trying to predict.
Trevor came up with an idea to automate the labeling part of the process—arguably the most time-intensive part. Basically, the idea was to use images that feature items over transparent backgrounds. All of the major search engines allow an advanced search for transparent images. If the item is the only object in the image, it is relatively simple and straightforward to write a script that draws a bounding box around it.
If you'd like some more detail on this, Trevor wrote a blog post about it.
Automated Background Removal
There was one big issue with this auto-labeling process. Finding a thousand unique images of a single class of object is already something of a task. And depending on the object, finding that many without backgrounds is virtually impossible.
For the images that had backgrounds, we would either have to manually label them, or find a way to automate the process and build it into the pipeline. Because the script to label images without backgrounds was already written and working, we decided to find a way of automatically removing the background from images.
This is the part of the pipeline that I built.
I'll give a brief overview here of how I built a system for automatically removing backgrounds from images. If you're curious about the details, I wrote a separate blog post on the topic:
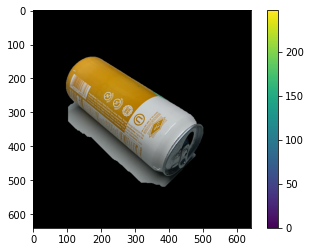
Automated Image Background Removal with Python I tested out a few different methods of image background removal, with varying degrees of success. The highest quality results came from creating a batch task in Adobe Photoshop, as whatever algorithm powers its "Select Foreground" functionality is very consistent and accurate. However, we could not use this method because it could not be added to the pipeline—I was the only one with a license, meaning the speed of my computer and internet could cause a major bottleneck.
Another method I tested out was the OpenCV implementation of an algorithm called GrabCut. Long story short, I wasn't able to get the quality we needed from it, as can be seen below.
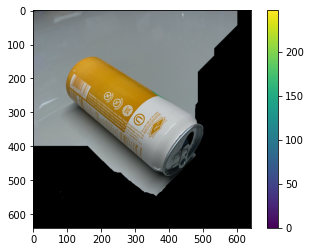
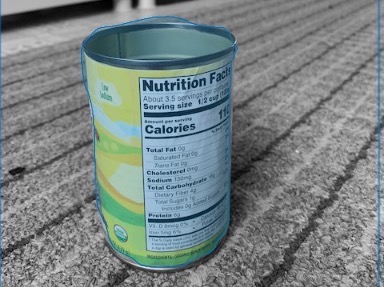
The main issue is that the algorithm is "interactive". That is, it uses the coordinates of a rectangle surrounding the object in the image for which the foreground should be extracted. For best results, the coordinates are generated manually for each image. The tighter that rectangle surrounds the foreground, the better the outline will be.
The above image is my attempt at simply using the entire image as the rectangle. As can be seen below, the result was much better when I tightened the rectangle around the can. I tried for many hours to find an automatable solution to this, but could not get results that were quite good enough. I decided to move onto other strategies.
Ultimately, I ended up building a short image processing pipeline that utilized a pre-trained image segmentation model (similar to object detection) to find the object(s) in the image. I initially built the pipeline with a library called Detectron2, based on PyTorch. However, after running into some issues with it, I decided to reimplement the pipeline using Mask R-CNN, based on TensorFlow.
Part of the output of the image segmentation model is a series of coordinates that describe an outline of the object(s) in the image. I used that as a binary mask to define the area of the image that should be kept, making the rest of it transparent.
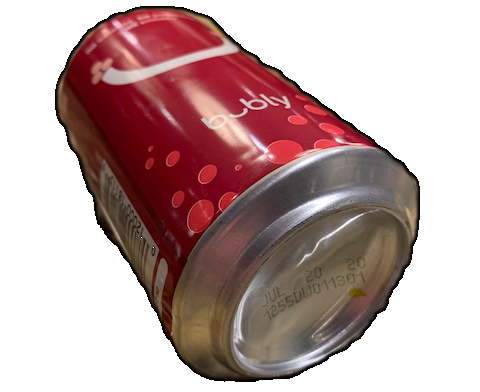
Unfortunately, I did not have much time to spend on improving the performance of the image segmentation model, and as a result there was still a fair amount of manual labeling to be done after the pipeline. I could (and should) have trained the image segmentation model using a small subset of images from each class. This would've made the output mask much more accurate and reduced the time spent fixing the labels afterwards.
As it was, using only the pretrained weights, there were some object classes that it performed very well on, while for others it did not.
Running the Pipeline
As with building the pipeline, we split up the 73 classes evenly amongst the four of us (around 18 classes each) and got to work gathering and labeling the images.
If we'd had a couple more weeks to spend improving the pipeline, this process likely would not have taken so long or been so tedious. As it was, we spent the better part of 4 weeks gathering and labeling the dataset.
I believe the pipeline did save us enough time to make it worth the extra time it took to build. Plus, I got to learn and apply some cool new tech!
The Model
Architecture
The neural network architecture we used to train the main object detection system used in the app is called YOLOv3: You Only Look Once, version 3.

YOLOv3 is a state-of-the-art single-shot object detection system originally written in C. One of the main reasons we used this one in particular was its speed—a benefit of single-shot algorithms. With the YOLO algorithms, object detection can be run in real time. For example, it could be run on a live security camera feed, detecting when someone enters a property.
Training
The vast majority of the work we put into this model was building a high-quality dataset. We used transfer learning to give the model an initial training kickstart. We were able to benefit from previous training done by the algorithm's developers by loading the weights from convolutional layers that were trained on ImageNet.
Our model was trained on a GPU-enabled AWS Sagemaker instance. After about 60 hours, our model reached a total average precision of 54.71%.
As expected, the model performs much better on certain classes of objects. The more easily recognizable classes (tires, printers, disks, digital cameras, plastic bottles) had average precisions in the 80-90% range.
On the other hand, the lower precision object classes were usually those that took on a wider variety of shapes, textures, and colors. For example, musical instruments, food waste, office supplies. It makes sense that, given a similar amount of training data, classes like this would be more difficult to distinguish.
Here is the breakdown for the 13,000 weights - mAP (mean average precision):
detections_count = 82369, unique_truth_count = 10934
class_id = 0, name = aerosol_cans, ap = 54.87%           (TP = 54, FP = 45)
class_id = 1, name = aluminium_foil, ap = 42.11%         (TP = 32, FP = 22)
class_id = 2, name = ammunition, ap = 55.38%     (TP = 61, FP = 49)
class_id = 3, name = auto_parts, ap = 41.70%     (TP = 31, FP = 21)
class_id = 4, name = batteries, ap = 62.19%      (TP = 92, FP = 44)
class_id = 5, name = bicycles, ap = 79.86%       (TP = 86, FP = 22)
class_id = 6, name = cables, ap = 64.81%         (TP = 76, FP = 40)
class_id = 7, name = cardboard, ap = 52.99%      (TP = 50, FP = 41)
class_id = 8, name = cartridge, ap = 70.16%      (TP = 68, FP = 25)
class_id = 9, name = cassette, ap = 53.45%       (TP = 13, FP = 10)
class_id = 10, name = cd_cases, ap = 80.11%      (TP = 30, FP = 3)
class_id = 11, name = cigarettes, ap = 29.43%            (TP = 38, FP = 56)
class_id = 12, name = cooking_oil, ap = 69.23%           (TP = 61, FP = 25)
class_id = 13, name = cookware, ap = 70.76%      (TP = 81, FP = 83)
class_id = 14, name = corks, ap = 57.99%         (TP = 55, FP = 32)
class_id = 15, name = crayons, ap = 52.43%       (TP = 44, FP = 25)
class_id = 16, name = desktop_computers, ap = 75.17%     (TP = 34, FP = 12)
class_id = 17, name = digital_cameras, ap = 93.40%       (TP = 120, FP = 15)
class_id = 18, name = disks, ap = 90.14%         (TP = 90, FP = 25)
class_id = 19, name = doors, ap = 0.00%          (TP = 0, FP = 0)
class_id = 20, name = electronic_waste, ap = 73.97%      (TP = 50, FP = 16)
class_id = 21, name = eyeglasses, ap = 21.75%            (TP = 24, FP = 37)
class_id = 22, name = fabrics, ap = 52.17%       (TP = 69, FP = 52)
class_id = 23, name = fire_extinguishers, ap = 30.32%            (TP = 22, FP = 30)
class_id = 24, name = floppy_disks, ap = 78.26%          (TP = 83, FP = 53)
class_id = 25, name = food_waste, ap = 19.16%            (TP = 28, FP = 22)
class_id = 26, name = furniture, ap = 3.45%      (TP = 0, FP = 0)
class_id = 27, name = game_consoles, ap = 58.90%         (TP = 45, FP = 19)
class_id = 28, name = gift_bags, ap = 65.97%     (TP = 72, FP = 48)
class_id = 29, name = glass, ap = 72.21%         (TP = 149, FP = 49)
class_id = 30, name = glass_container, ap = 0.00%        (TP = 0, FP = 0)
class_id = 31, name = green_waste, ap = 57.38%           (TP = 61, FP = 55)
class_id = 32, name = hardware, ap = 24.78%      (TP = 28, FP = 62)
class_id = 33, name = hazardous_fluid, ap = 79.06%       (TP = 85, FP = 10)
class_id = 34, name = heaters, ap = 71.18%       (TP = 54, FP = 50)
class_id = 35, name = home_electronics, ap = 32.91%      (TP = 83, FP = 92)
class_id = 36, name = laptop_computers, ap = 41.66%      (TP = 95, FP = 55)
class_id = 37, name = large_appliance, ap = 5.91%        (TP = 7, FP = 38)
class_id = 38, name = lightbulb, ap = 28.36%     (TP = 61, FP = 28)
class_id = 39, name = medication_containers, ap = 59.85%         (TP = 88, FP = 46)
class_id = 40, name = medications, ap = 55.37%           (TP = 68, FP = 39)
class_id = 41, name = metal_cans, ap = 52.21%            (TP = 82, FP = 24)
class_id = 42, name = mixed_paper, ap = 37.32%           (TP = 64, FP = 43)
class_id = 43, name = mobile_device, ap = 63.24%         (TP = 151, FP = 97)
class_id = 44, name = monitors, ap = 39.15%      (TP = 75, FP = 77)
class_id = 45, name = musical_instruments, ap = 20.67%           (TP = 44, FP = 42)
class_id = 46, name = nail_polish, ap = 84.06%           (TP = 105, FP = 30)
class_id = 47, name = office_supplies, ap = 7.01%        (TP = 30, FP = 52)
class_id = 48, name = paint, ap = 47.56%         (TP = 54, FP = 25)
class_id = 49, name = paper_cups, ap = 76.20%            (TP = 85, FP = 32)
class_id = 50, name = pet_waste, ap = 31.60%     (TP = 5, FP = 1)
class_id = 51, name = pizza_boxes, ap = 61.07%           (TP = 69, FP = 38)
class_id = 52, name = plastic_bags, ap = 31.45%          (TP = 39, FP = 36)
class_id = 53, name = plastic_bottles, ap = 77.49%       (TP = 303, FP = 92)
class_id = 54, name = plastic_caps, ap = 22.99%          (TP = 5, FP = 1)
class_id = 55, name = plastic_cards, ap = 57.51%         (TP = 45, FP = 14)
class_id = 56, name = plastic_clamshells, ap = 74.12%            (TP = 36, FP = 16)
class_id = 57, name = plastic_containers, ap = 71.93%            (TP = 104, FP = 47)
class_id = 58, name = power_tools, ap = 75.21%           (TP = 77, FP = 58)
class_id = 59, name = printers, ap = 88.06%      (TP = 106, FP = 62)
class_id = 60, name = propane_tanks, ap = 62.89%         (TP = 36, FP = 15)
class_id = 61, name = scrap_metal, ap = 0.00%            (TP = 0, FP = 0)
class_id = 62, name = shoes, ap = 83.53%         (TP = 64, FP = 12)
class_id = 63, name = small_appliances, ap = 80.61%      (TP = 93, FP = 34)
class_id = 64, name = smoke_detectors, ap = 79.73%       (TP = 65, FP = 10)
class_id = 65, name = sporting_goods, ap = 3.34%         (TP = 0, FP = 0)
class_id = 66, name = tires, ap = 83.31%         (TP = 77, FP = 11)
class_id = 67, name = tools, ap = 69.69%         (TP = 113, FP = 37)
class_id = 68, name = toothbrushes, ap = 2.92%           (TP = 1, FP = 1)
class_id = 69, name = toothpaste_tubes, ap = 59.78%      (TP = 35, FP = 9)
class_id = 70, name = toy, ap = 49.70%           (TP = 47, FP = 24)
class_id = 71, name = vehicles, ap = 4.51%       (TP = 1, FP = 4)
class_id = 72, name = water_filters, ap = 47.91%         (TP = 36, FP = 21)
class_id = 73, name = wood, ap = 76.15%          (TP = 105, FP = 51)
class_id = 74, name = wrapper, ap = 72.45%       (TP = 67, FP = 18)
 for conf_thresh = 0.25, precision = 0.65, recall = 0.41, F1-score = 0.50
 for conf_thresh = 0.25, TP = 4507, FP = 2430, FN = 6427, average IoU = 51.08 %
 IoU threshold = 50 %, used Area-Under-Curve for each unique Recall
 mean average precision (mAP@0.50) = 0.523220, or 52.32 %
Total Detection Time: 564 Seconds
Set -points flag:
 `-points 101` for MS COCO
 `-points 11` for PascalVOC 2007 (uncomment `difficult` in voc.data)
 `-points 0` (AUC) for ImageNet, PascalVOC 2010-2012, your custom dataset
Deployment
In order to utilize our hard-earned trained weights for inference in the app, I built an object detection API with Flask and used Docker to deploy it to AWS Elastic Beanstalk.
The trained weights were loaded into a live network using OpenCV, which can then be used for inference (prediction; detecting objects). Once a user takes a photo in the app, it is encoded and sent to the detection API. The API decodes the image and passes it into the live network running with the trained weights. The network runs inference on the image and sends back the class of item with the highest predicted probability.
Again, I go into much greater detail on the API in a separate blog post (link to come, once it's published).
Potential Improvements
Although we had eight weeks for this project, we were starting with a completely green field. Therefore, at least the first two weeks were dedicated to discussions and planning.
The result of scope management is features and ideas left unimplemented. At the beginning, the entire team brainstormed a lot about potential ideas for the app. And throughout the project, the machine learning team was always thinking and discussing potential improvements. Here is a brief summary of some of them.
The first and most obvious one is to simply expand the model by gathering and labeling an even wider variety and even greater numbers of images. By breaking out the grouped items into more specific classes and gathering more images, the model could be trained to distinguish between some of the visually similar (though materially different) objects.
Furthermore, there are some low-hanging fruit that would likely make the model more robust. One of those that we did not get to explore due to lack of time is image augmentation. In a nutshell, image augmentation is a method of artificially growing an image dataset by "creating" new images from the existing ones by transforming or otherwise manipulating them.
These augmentations could include changing the color, crop, skew, rotation, and even combining multiple images. The labels are also transformed to match the location and size of the transformed objects in each image. Not only does this process help create more training data, but it can also help the model extract more of the underlying features of the objects, allowing it to be more robust to a greater variety of lighting conditions and camera angles.
Another way to increase the size and variety of the dataset would be to add a feature that gathers the images (and labels) taken by the user. After every prediction that is served, the user could be presented with a box containing two buttons, one indicating that the prediction was correct, the other, incorrect. The correct ones could go straight to the server to wait until the next model training round. And if the user indicates that the predicted class was incorrect, they could be presented with an interface to draw a box around the object and choose the correct class. Then that image and label would be sent to the server to be used in training.
The last idea was one that the entire team discussed at one point, though is a feature that would likely only be possible with some kind of financial backing. The idea is to implement a system that recognizes when many of a similar type of object are detected—those need to be recycled at the same facility, for example—and can pay drivers to pick all of those items up and take them to the proper facilities. In other words, be the "UBER for recycling".
Team Links
I said it before and I'll say it again: the team I worked with on this project was top-notch. Here they are in all of their glory, with all of their portfolios/blogs/GitHubs (those that have them) in case you want to check out their other work.
Machine learning
Web development
User Experience
- Kendra McKernan
- Lynn Baxter
Other Links
I linked to this video above but figured I'd include it here as well. It's the video that Trevor created to pitch the idea (originally called 'Recycle This?') to the Lambda Labs coordinators. Also included is another video he created to demo the final product.
As always, thanks for reading, and I'll see you in the next one!